In this article we share 10 Social Media Infographic Tips (+5 Tools).
According to research, at least 60% of the population is a visual learner. And when it comes to social media marketing is effective when you add visuals to your work.
But how the game had shifted its course in marketing online. You are fun to be with, so why not bring that energy to life? There are many ways to tell people about your product, but it gets more spice when you include illustrations in your presentation.
Doodling is not only for children. Harness the power of children by bringing in a pleasant mood that makes people see you even if you are not talking in front of a camera or dancing the grooves to catch people’s attention.
Looking good on content has never been better! Here are the tips for your social media infographics and the five tools to help you.
Table of Contents
What is a social media infographic?
Social media infographics boost your content by using diagrams, charts, and icons with minimal text. This content represents a long post using illustrations to represent your data in a new and fun way. That is one work social media marketing does.
Social media infographics are like a thousand words converted into graphics. It is easier to use and share everything you want to tell people about your business when you are on social media. Applying social media infographics is one of the best strategies you can use in social media marketing.
How do you create social media infographics?
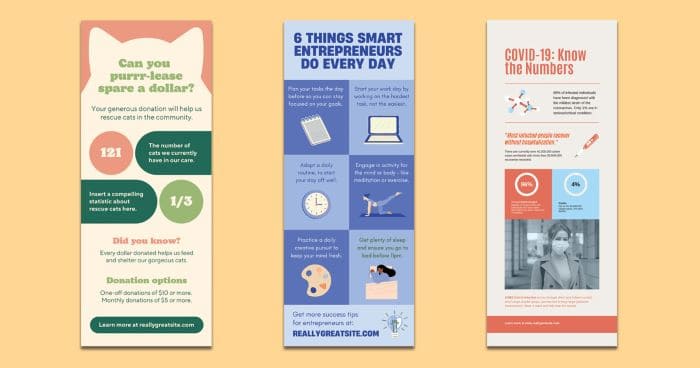
Firstly, choose a template that you will use for your social media infographic. The infographics would be in line with your objective. Here are the types of social media infographics that you may want to check out depending on what data you want to tell. It is vital in social media graphic design.
- Flowchart infographic: this is perfect for a workflow presentation or how things process in your industry, such as steps in making an infographic.
- A timeline infographic: is for presenting the history of a company. One example is the history of coke from when it started and what it is now today.
- Graph-based infographic: if you have an expert-level audience and want to present multiple data, this is the best infographic you can use—for example, statistic data of a male and female person working in social media marketing.
- Side-by-side comparison infographic: this is a presentation used to explain the difference between two things. Such as describing the colors pink and blue as gender-based colors.
Image-heavy infographic: this is a fun way of presenting information about trends using shapes, photography, and design.
Second, another social media tip that you need to know is the infographics you will have an audience. Harvard Business Review shared the different audiences that you present. These are:
- Novice
- Generalist
- Managerial
- Expert
- Executive
Third, research and review your content. Organize your content depending on your project. Remember that your infographic tells people about the data and not your opinion.
Lastly, edit your infographics. This part may take up the most time.
You want to make your infographics fun, short, and informative. Come up with an icky icon, eye-catching illustrations, and short texts.
There are so many icons from Canva or other sites such as TinyPNG or DrawKit that you can choose the elements you like.
Research for colors that are cool to the eyes. In this way, people will have a fun and relaxed experience. You can use light shades of blue such as powder blue or pink such as bubblegum pink. The colors, of course, depend on your brand color.
Your information should be updated and correct. Misleading information can lead to some problems in the long run. Your choice of color and styles are crucial in social media graphic design.
If you are feeling lost, then fret no more. Here are the tips that could help your infographic stand out.
Tips on How to Design and Publish Infographics on Social Media
1. Create an Attention-Grabbing Headline
Your attention-grabbing headline in your social media infographics doesn’t need to belong to this one. Simple and short words are the best choice. People on social media scroll so fast that they do not have time to read your long title.
Sample catchy titles are using the words such as YOU ARE AMAZING! The best words that you can use can relate to emotions such as happiness or sadness.
Here are the catchy sample words that you can use for your social media infographics
Free: Who wants to get something too pricey? Nah! I bet you want to get that free thing. You get too curious to see what’s in it for you. People read your post because it sparked their curiosity about the sure-free thing you have mentioned.
Guaranteed: This word brings confidence to the reader. That confidence will give you another sale. When a person is confident about what they read about your post, it will always get followed more often than not. If the company could not deliver, that would mean a big problem for both the writer and the owner.
New: When people see the word “NEW” in front of them, it changes the client’s mood into a positive atmosphere.
It may make them alert and excited. Something new is different. It means that there is still something that your clients can learn beyond the things that they have already.
Complete: this word also means giving a solution to a problem. For example, when you are sewing your clothes, isn’t it great if you get all the things you need for sewing in one box? You need to get a complete set of materials right next to your fingertips.
Using this word can attract your client that you are giving them a solution to their problem. You are making the world a better place.
Quickly: this word is used when you want to tell everyone that you can fix things in the least amount of time. This word is helpful to say to people that it is alright. Things will get better soon.
Accessible: Your headline speaks of things that are not so difficult to do. This word can catch a reader that needs a simple way to learn or solve something. Come on! It is so easy you can do it with your eye shut! That’s what the reader wants to feel.
Proven: This word helps people tell them that you are telling the truth backed by reliable sources. You are a person of true identity and what you are telling people is correct.
More: These words may tell readers that you have something to add to their needs. Also, it means you have a lot of things to do.
Secret: the word, as it implies, may bring excitement to the reader.
You: engage with your readers. The attention is on them as you use this word, just like what you are reading.
Yes: Positivity! That’s what people need these days. It’s better to read a positive word and attract a person’s attention.
Remember that a headline should be clear, persuasive, and attractive.
2. Find Balance Between Info and Graphic
Not all text! When making your social media infographic, the best practice is not to have too much text in it and not too many icons. Be simple. Just like you are making a clear picture in your mind. Always stick to your objective.
3. Make Use of White Space
White space is a space between your elements. It is a simple space that you see when you scroll down your infographics. Once again, use the white space to your advantage because this helps your viewers to focus on your content. The white space will allow your readers to see your presentation.
4. Find the Most Relevant Data
One of the best practices in social media infographics is well-researched data. Make sure that the source you are taking this data from is reliable. Triple check your data to avoid misleading claims and problems in the end.
5. Determine the Best Data Visualization Types
Having visualization of your data can help you explain your point. Sit down and think over the best visualization type you will use with the data you are going to present. Some examples of these types are
Mosaic or Mekko charts: One of the best charts to use when you are to compare multiple data in one presentation
Pyramids: when you compare population trends, this graph is helpful for you.
Spider charts: This chart is helpful when you compare three related things: age, volume, and distance.
Stock graphs: this is one of the samples for finance graphs. When you talk about money, this graph is excellent for you. These graphs are line graphs to see your money if it goes up and down.
6. Stick to only 2-3 Fonts
Being artistic is fun. Yet, in infographics, fonts are essential. Lessening the use of fonts in your content is very helpful so readers can focus on the information you want to tell them. Here are the readable fonts that you can use.
Open Sans: this font is readable and available on the web.
Georgia: this font is easy to read on the computer screens.
Helvetica: looks excellent on your infographic’s titles.
Verdana: best used when you have bigger fonts.
Rooney: has rounded serifs that give a friendly feel.
Ubuntu: is a combined font of the libre and open font.
Futura: this is a new sans serif case based on geometrical shapes.
Lato: is a sans serif font, best used in headers and captions.
7. Pick a Color Scheme With 2-3 Colors
Colors are beautiful and can capture the attention of your leaders. Yet, we would instead give your reader’s brain a break. Too much color may overwhelm the brain, so stick to 2 to 3 colors.
8. Stay Consistent
Remember to be consistent about your design in your social media infographics. Your design looks best if it stays the same and doesn’t change every so often in each section of your content. Such as fonts are the same, colors scheme is the same, and so forth.
9. Cite Your Sources
You are reaching out to strangers. One thing that you wanted to tell them is that you are reliable. All your sources say what is accurate and true. Share with people where you read your data so they can rely on you.
10. Include Your Logo/Website URL
Your logo and website URL are the essential things to your infographic. So that people may know who made it. Bring your brand forward in your infographics.
5 Tools to Help You Design Infographics for Social Media
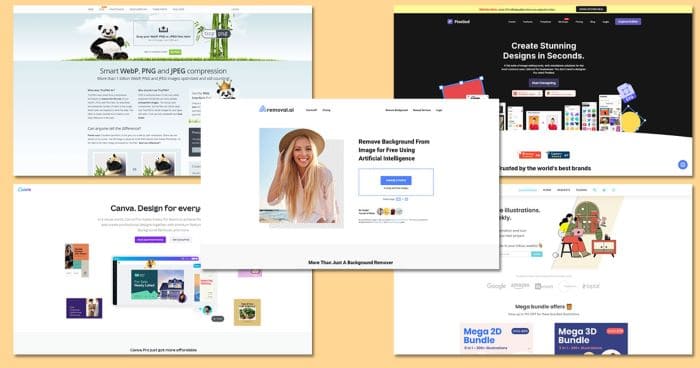
1. TinyPNG
TinyPNG is used to compress your social media graphics design. You wanted to put in your work, but it takes too long to load? Then this tool can help you with your job to make it more fun. Imagine when you click and puff! It comes right in.
2. Removal.AI
Right, this tool is so helpful when you are trying to remove the background from your images. It is time-efficient that you want to use it more when you use it. Removal.AI is the best tool for one of the photos you will be using for your social media infographics design.
3. Canva
Say that again? Could you get tons of elements for free? Yes, Canva offers free stuff that you can use in social media infographics. There are charts, icons, and different text fonts that you can choose. With simple clicks, then you have one of the Awesomeness designs.
4. Pixelated
Do you get stuck choosing your photos’ borders, filters, and dimensions? This tool can help you add stunning designs to your photos. Templates are ready to use. You need to hover on a design that you like and then click on it.
5. DrawKit
Are you lost with illustrations and graphics for your social media infographic? Fret no more, friend. This tool has hundreds of ready-made icons, images, and plugins to enjoy. There are several choices you can have right at your fingertips. Some illustrations are free, and some are not.
Conclusion
Social media infographics have changed the game course of marketing online, Infographics also continue to be important in SEO.
From informative to pitching a sale, all are in there. Using the icons, charts, and illustrations has never been this fun. Explore and let your mind know that there are no limitations when using your imagination. Using the right tools and tricks can bring your infographic to the spotlight.
Join The Logo Community
We hope these 10 Social Media Infographic Tips (+5 Tools) have been helpful. If you would like more personal tips, advice, insights, and access to our community threads and other goodies, join me in our community. You can comment directly on posts and have a discussion.
*TIP – We use and recommend DesignCuts for all your fonts, mockups and design bundles.
 Author Bio
Miguel Davao particularly loves to write content on social media, design, photo-editing tools, and content writing tips. He works as a full-time writer at Removal.AI – an AI tool used to remove bg from images for social media, eCommerce, web design, and marketing automation.